In case you’ve been out of the loop, as Universal Analytics is sunsetting, we will only have access for historical reporting until July 1, 2024. After this date, no future data will be available in reporting. TL;DR if you don’t back up your Universal Analytics data before the 1st of July 2024, you will lose your precious data forever. Luckily, there are options and some are free and comprehensive to use.
Key Takeaways
- You can back up Universal Analytics until the end of June 2024. After that date you’ll lose access to all historical data.
- Saving historical data is crucial for making informed marketing decisions and understanding customer behavior over time.
- There are several methods to export UA data, including manual exports, third-party connectors, the Google Analytics Reporting API, or Maya.
- One easy way to do so is by exporting UA data in GA. You can choose between 3 different file types: PDF, spreadsheet, and CSV. This is a tedious and risky backup method.
- There are smarter, faster, and more reliable ways to make a backup of Google Analytics data.
- Maya offers a free, user-friendly solution for exporting UA data to BigQuery, with a pre-built data model.
…And in order to make things a little bit faster.
| Your Options Before Maya | Your Options After Maya |
|---|---|
| Manual exports to CSV, PDF, or spreadsheets are time-consuming and prone to errors | Automated, reliable data export process with just a few clicks |
| API Connector for Google Sheets requires technical knowledge and has limitations | No technical expertise needed, making it accessible to all users |
| Google Analytics Sheets Addon with limited functionality, lack of support, and data volume constraints | Robust, fully-supported solution with no data volume limitations |
| Advanced options like Google Analytics Reporting API and Looker Studio have steep learning curves and technical challenges | User-friendly interface and pre-built data model, eliminating technical complexities |
| Third-party connectors like Supermetrics and Analytics Canvas come with costs and setup requirements | Free, cost-effective solution with minimal setup requirements |
| BigQuery export with Google Analytics Reporting API requires technical expertise and cost management | Seamless integration with BigQuery, handling technical aspects and cost optimization |
| Incomplete data backups with manual exports, lacking full UA platform functionality | Comprehensive data backups ensuring access to all historical data and UA platform features |
| Access to raw data difficult to understand how to connect | Powerful data analysis with Maya’s pre-built data model and semantic clustering |
Table of contents:
- Why Bother Saving Old Google Analytics Data Anyway?
- Options for Exporting Google Analytics Data
- The Step-by-Step Guide to Exporting your UA Data to Excel, Google Sheets, or CSVs
- API Connector for Google Sheets: A So-So Solution for UA Data Backup
- Google Analytics Sheets Add-On: The Abandoned Ship
- Google Analytics Reporting API and Looker Studio: The Developer’s Playground
- Third-Party Connectors for UA Data Backup
- BigQuery Export with Google Analytics Reporting API: Powerful but Proceed with Caution
- Tackling the UA Sunset with Maya’s Free Google Analytics Integration
But first some context…
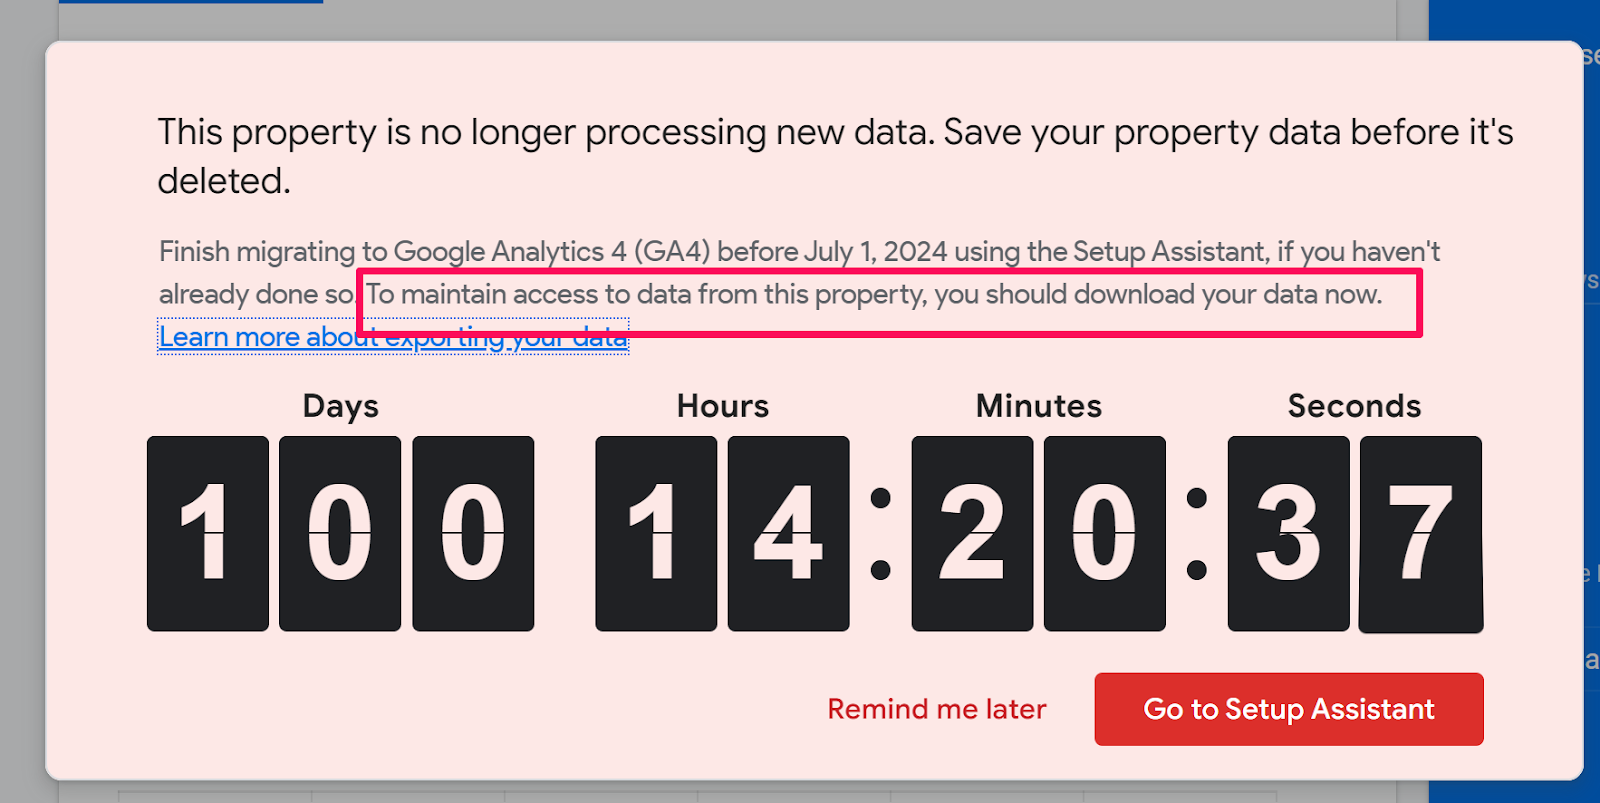
Google Analytics offered two main versions: UA and Google Analytics 4 (GA4). UA, the industry standard for years, is no longer processing new data. While existing data remains accessible until July 1, 2024, it will eventually become unavailable.
Users will lose access to Universal Analytics properties and the API entirely, even with read-only access, and all data will be deleted starting the week of July 1, 2024.
According to Google
Starting the week of July 1, 2024: You won’t be able to access any Universal Analytics properties or the API (not even with read-only access), and all data will be deleted. While the standard sunset took weeks to complete, the full Universal Analytics shutdown will happen within a week. We know your data is important to you, and we recommend that you export your previously processed data before this date.
Why Bother Saving Old Google Analytics Data Anyway?
Imagine trying to navigate a tricky labyrinth without a map. That’s what decision-making in marketing is like without access to historical data. It turns into a high-stakes guessing game, and no one wants to be gambling with their business.
When you save your UA data, you’re essentially futureproofing your marketing insights. Data from past campaigns becomes your oracle for future reference. You can revisit historical trends, analyze long-term performance, and detect patterns that might conceal themselves otherwise. For SaaS and B2B companies, this stuff is pure gold.
Addressing July Changes with Confidence
As July 1, 2024 approaches, there’s a growing sense of urgency among marketers and business owners alike to safeguard their Universal Analytics (UA) data. Here are some actionable tips to help navigate this transition smoothly:
- Make sure your Google Analytics 4 (GA4) implementation is fully prepared to be the primary source of data and reporting elements.
- Now is the time to determine which data points from UA are essential for your business’s long-term strategy. Whether it’s gauserType, gapageviews, or any other metric from your UA data, your focus should be on identifying and securing these key pieces of data.
- Backup and archive critical historical data from UA to prepare for any unexpected reporting needs post-sunset, ensuring data is stored in platforms like BigQuery.
Options for Exporting Google Analytics Data
Let’s look at your options at a high level. Further down to the article we will give you guidance on how to succeed or not with any of these options.unique possibilities from the simplest to the more complex.
Manual Exports: The DIY Approach
- Scope: Export specific reports or data segments for focused analysis.
- Challenges: Time-consuming, repetitive, and prone to errors. Limited data volume and customization options.
API Connector for Google Sheets: The Technical Sidekick
- Scope: Leverage the power of the Google Analytics Reporting API within Google Sheets.
- Challenges: Requires technical setup, API knowledge, and potential limitations compared to direct API access.
Google Analytics Sheets Add-On: The Abandoned Ship
- Scope: Pull UA data directly into Google Sheets for analysis.
- Challenges: Limited functionality, lack of support, and potential data volume constraints.
Google Analytics Reporting API and Looker Studio: The Developer’s Playground
- Scope: Automate data extraction and customize exports for specific needs.
- Challenges: Requires technical expertise, coding knowledge, and ongoing maintenance.
Third-Party Connectors for UA Data Backup
- Scope: Automate data export process and handle larger datasets.
- Challenges: Additional costs, compatibility issues, and potential learning curves.
BigQuery Export with Google Analytics Reporting API: Powerful but Proceed with Caution
- Scope: Store and analyze massive amounts of UA data in a robust, scalable environment.
- Challenges: Technical setup, cost management, and data governance requirements.
Maya: Your UA Data for Free
- Scope: Automatically export UA data to BigQuery for free, with a pre-built data model and seamless BI tool integration.
- Challenges: None! Maya takes care of the heavy lifting, so you can focus on what matters most: uncovering insights and driving growth.
The Step-by-Step Guide to Exporting your UA Data to Excel, Google Sheets, or CSVs
Exporting your UA data to spreadsheets or CSVs is like dipping your toes in the kiddie pool of data backup. It’s user-friendly, but don’t expect Olympic-level results. These methods are pretty straightforward – something that’s always a plus.
Just start by clicking your way through the Google Analytics interface, selecting the type of report you want, and hitting the familiar ‘Export’ button. Voila! You’ve got data… but with some strings attached.
While these options are user-friendly, they do have their downsides. The main gripe here is huge operational burden, limited data volume and customization. It’s like trying to explore the world on a tricycle – you’ll get somewhere, but not very far or fast.
Manual Export from Google Analytics (UA) Account
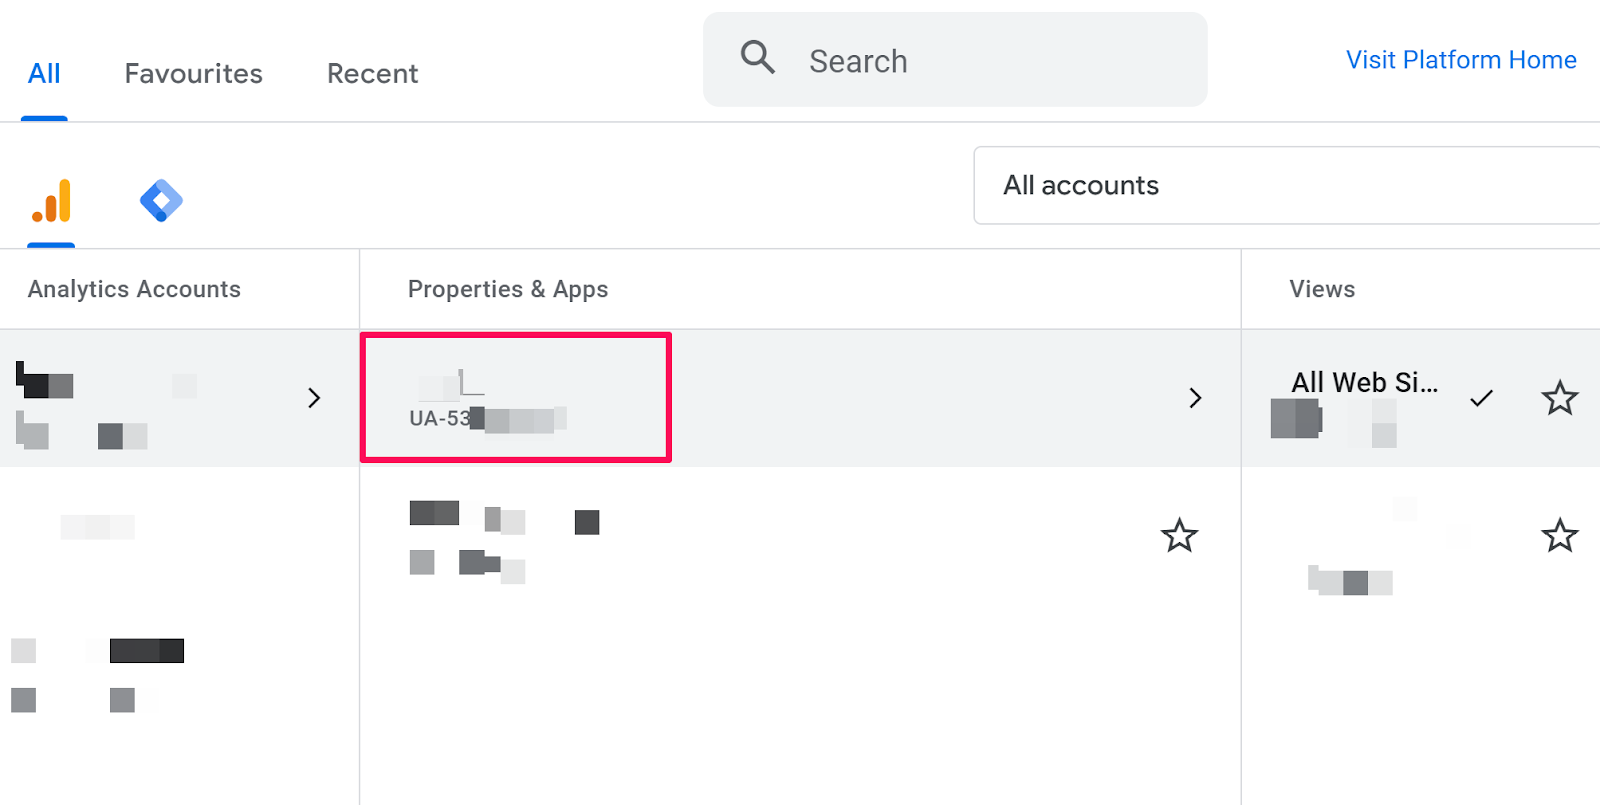
Access Your Google Analytics and Navigate to Your Account and Property
First things first, log into your Google Analytics account. Make sure you have the necessary permissions to access the data you need. Navigate to the specific account and the UA property that contains the data you want to export.
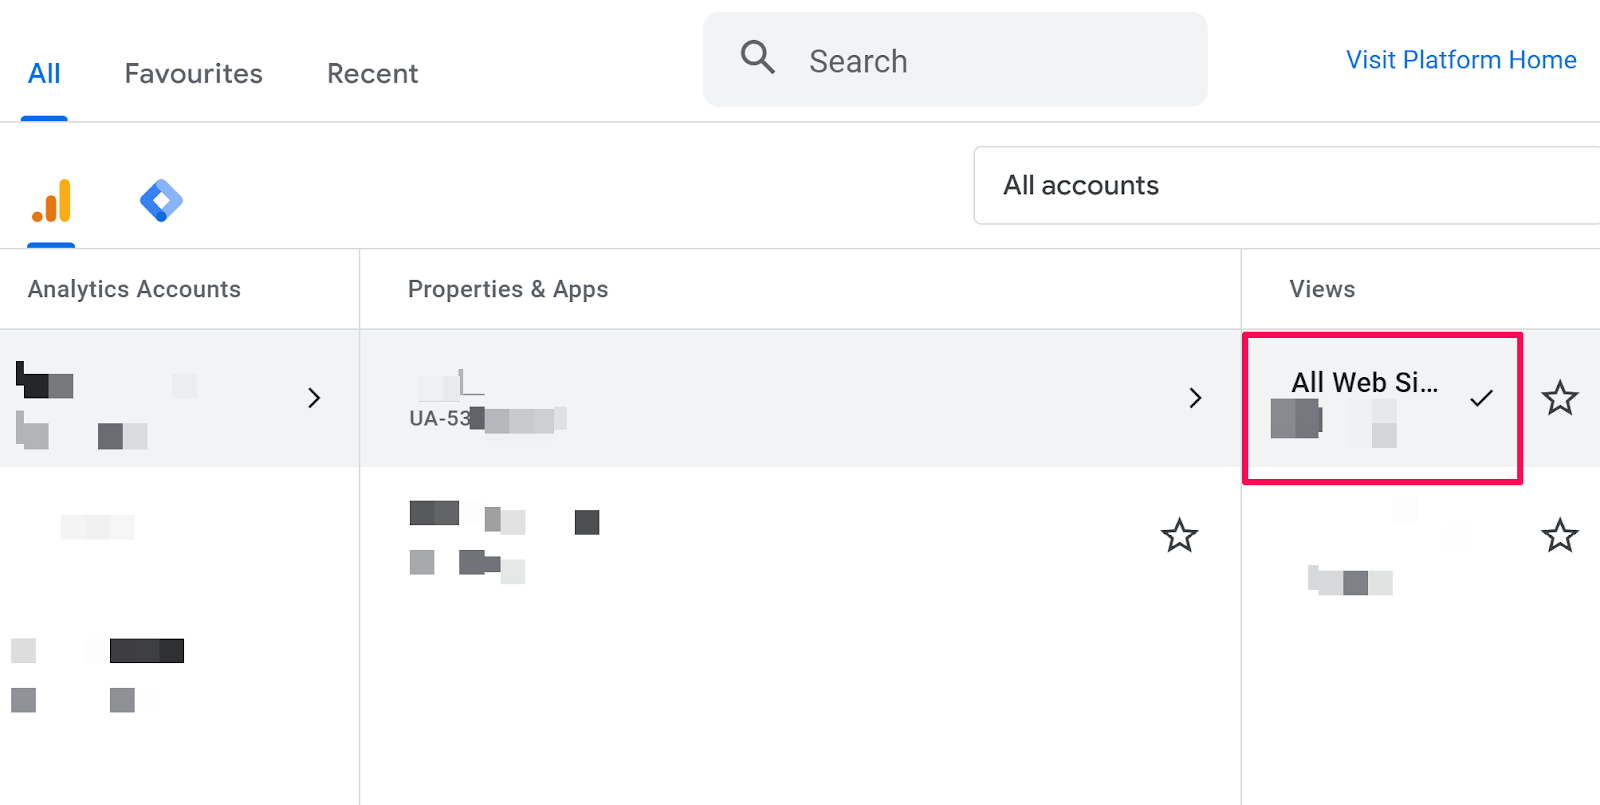
Select the View you Need
Now that you’re in the right property, it’s time to choose the view that holds the data you’re after. Views are like different lenses for your data, so pick the one that gives you the picture you need.
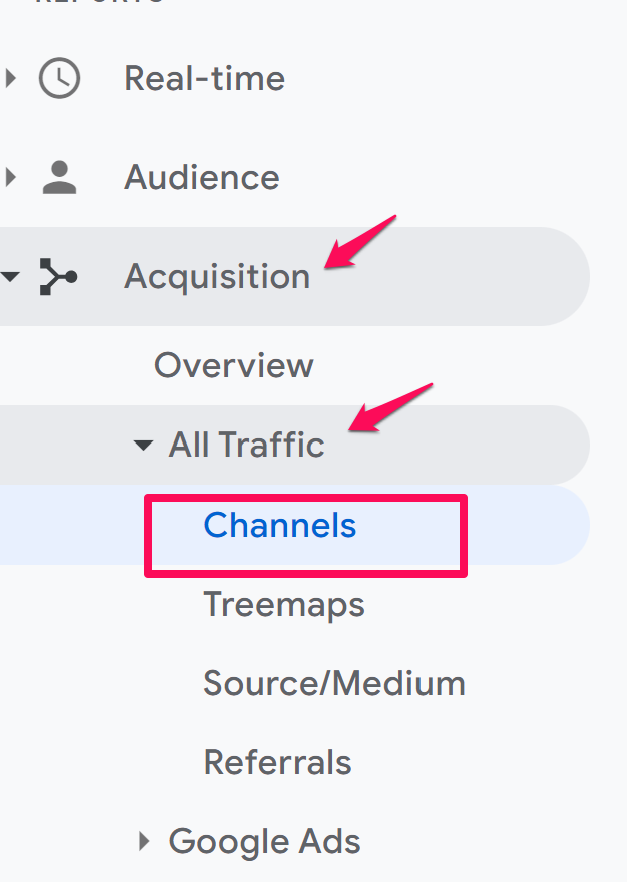
Find the Report You Need
Locate the report that has the data you want to export. As you already know Google Analytics offers a variety of reports under different categories such as Audience, Acquisition, Behavior, etc.
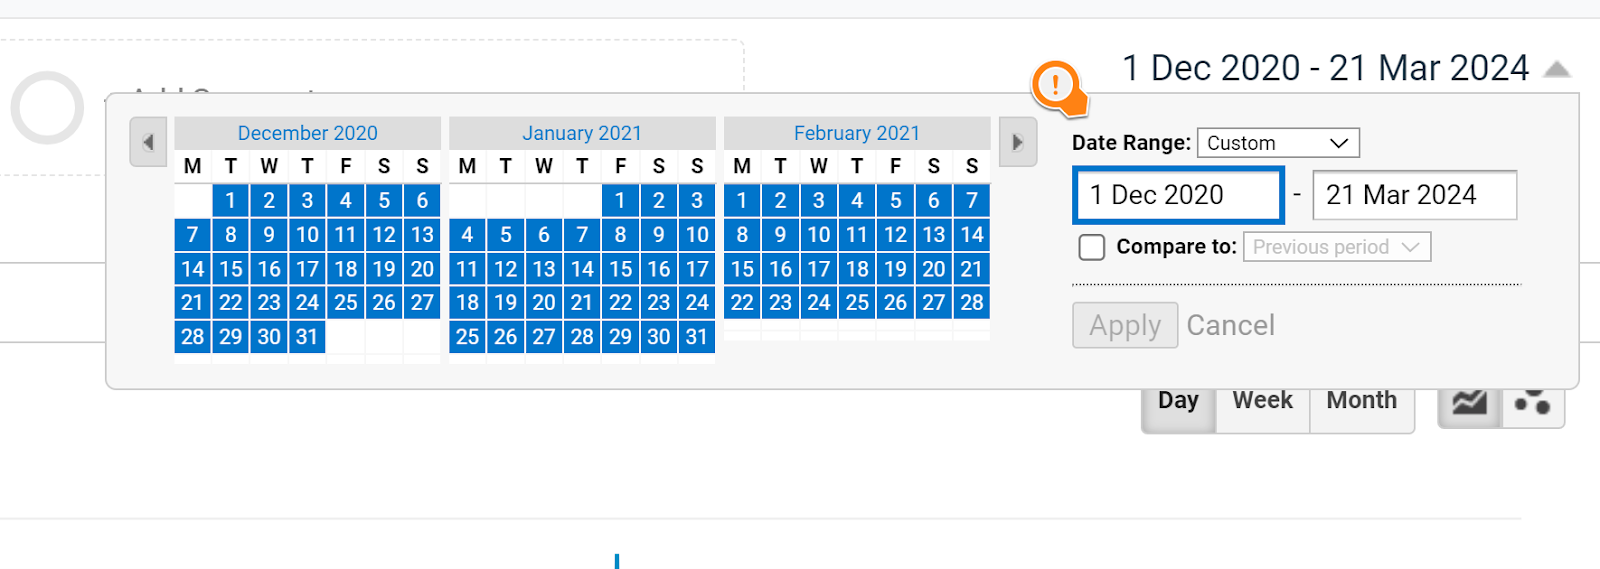
Set the Date Range
Choose the period that matters most to you, whether it’s the last month, quarter, or year to specify the period for which you want the data.
Hit the Export Button
You’ve found the report, set the date range, and now it’s time to export. Look for the “Export” button, usually located above the report chart or table, and click it to see the available file format options for exporting your data. Common options include CSV, PDF, Google Sheets, and Excel.

Choose Your Format Wisely
CSV, PDF, Google Sheets, Excel – the gang’s all here. If further analysis is required, CSV or Google Sheets might be your best bet. If you’re more of a visual person or need to present your findings, PDF might be the way to go.

Download or Save Your Data
Depending on your chosen format, your data will either download directly to your computer or prompt you to save it to your Google Drive (if you picked Google Sheets).
Rinse and Repeat (If Necessary)
If you need data from multiple reports, buckle up and get ready to repeat steps 3-7. Make sure to adjust your selections and date range for each report.
It’s like groundhog day, but with data exports.
Keep Your Exports Organized
After all that exporting, it’s important to keep your files organized. Create dedicated folders, name your files logically, and make sure everything is easy to find. Your future self will thank you when it’s time to analyze all that data.
Limitations of Manual Data Export for UA Sunset
While manually exporting data from UA seems like the easiest solution to secure your historical data before the July 2024 sunset, it’s important to understand its limitations.
Incomplete Backups
Manual exports are limited to the data displayed within specific reports. This means you might miss valuable insights if you don’t capture all relevant data points across various reports. Capturing your entire historical archive through manual exports would be incredibly time-consuming and potentially incomplete.
Data Volume Constraints
Exporting large datasets can be a tedious task with potential limitations on the amount of data you can export at once.
Time-Consuming
Manually exporting multiple reports can be a time-consuming process, especially if you need to export data regularly. They will also require additional formatting and manipulation to be usable for future analysis.
Limited Historical Range
You’re restricted to the date range you specify within each report. If you need historical data across longer timeframes, manual exports won’t capture everything in one go.
Error-Prone
Manually exporting data increases the risk of human error, especially when dealing with large and many datasets. In addition, custom metrics, configurations, or specific data points not included in the chosen reports might be missing from your exports.
Our verdict

What’s even the difference between CSV, PDF and spreadsheet exports of UA data?
The PDF is a snapshot of your data.
Everything looks exactly as it does on screen – layout, formatting, the works. It looks pretty but good luck trying to analyze or edit anything.
Possible? With the right tools, yes. Convenient? Not so much.
The verdict

The CSV: The Data Wilderness
When you choose to export your Universal Analytics (UA) reports as CSV files, you’re signing up for a journey that’s both familiar and a tad adventurous. They are like the Wild West of data formats. They’ll wrangle your data into a structured format, but be prepared for an organizational nightmare when dealing with multiple files. It’s like herding cats, but with commas.
Those CSV files will cozy up in your download folder just like PDFs, following a non easy to track naming rhythm. But crack one open, and it’s a whole different world inside vs the PDFs.
The good thing with this comma-laden wilderness, is you can import them to any tool and analyze them.
But working with a large number of individual CSV files for Google Analytics data backup can be a cumbersome and error-prone process, especially when it comes to importing and combining them later.
It is an organizational nightmare with managing numerous individual CSV files, keeping track of file names, dates, and data types becomes difficult. It is also a time-consuming and tedious task as it may require scripting or manual manipulation, increasing the risk of errors. Finally inconsistencies in formatting or data structure across different reports exported as separate CSVs can lead to problems during the merging process. This can compromise the accuracy of your historical data archive.
Our verdict
Spreadsheets: The Comfortable Middle Ground
Spreadsheets are the cozy middle ground between raw data and visual flair. They’re familiar, but don’t expect advanced analysis or snazzy visualizations without some serious elbow grease.
You download .XLSX files directly to your device or create Google Sheets that live in your cloud. Oh… and Google Sheets asks for a permission handshake every time, ensuring you’re okay with importing your UA data.

Spreadsheets may seem like the perfect middle ground for diving into your UA data, but they come with their own set of quirks. One of the most noticeable is the lack of unique file names when importing UA reports. Your Google Drive can quickly become a sea of identically named files, making it a challenge to keep track of which report is which.
While sharing these files with your team or external partners is a breeze, you’re still limited by the constraints of the spreadsheet format. Both Google Sheets and Excel have their limits when it comes to handling large amounts of data effectively. Exporting extensive UA datasets can lead to performance issues, formatting inconsistencies, or even data loss, which can be frustrating when you’re trying to analyze your data.
Another potential pitfall is that complex formulas or functions used within UA reports do not translate perfectly to spreadsheets. That leads to inaccurate data or the need for manual adjustments. It’s like playing a game of telephone with your data – the message might get a little garbled along the way.
When it comes to visual data presentation, spreadsheets offer a basic level of functionality unless you start adding your own layers of analysis and visualization.
Our verdict

Are Universal Analytics exports actually a backup? Spoiler Alert: Nope!
No, Universal Analytics (UA) exports are not technically complete backups in the traditional sense. They’ll give you the highlights, but you’re missing out on the full story. Exports only capture snippets of data from specific reports at a single point in time. It’s like trying to recreate a movie from a couple of still frames.
You’ll lose out on advanced analysis, custom configurations, and the ability to fully interact with your data. It’s like getting a postcard from your data’s vacation instead of being there yourself.
What UA Manual Exports Offer:
- UA exports capture specific data points or reports at the time of export. They represent a snapshot of your data for that particular time frame and configuration.
- Exports are limited to the data displayed within the chosen report or filtered view. They might not capture the entire dataset or historical information from custom configurations not included in the report.
Why UA Manual Exports Aren’t Full Backups:
- UA exports might not capture all historical data, especially if you don’t export every single report or use extensive filtering. Custom metrics or configurations not included in specific reports could also be missing.
- Exported data is static and doesn’t replicate the full functionality of UA. You cannot interact with the data, drill down for further analysis, or leverage advanced features available within the UA platform.
When UA Manual Exports Are Useful:
UA exports can be helpful for quick references or basic analysis, but they’re not a substitute for comprehensive backups. Though for companies with minimal historical data requirements, UA exports might suffice for basic reference purposes after the July 2024 sunset.
API Connector for Google Sheets: A So-So Solution for UA Data Backup
The API Connector for Google Sheets seems like a match made in heaven for backing up your UA data. But before you start celebrating, let’s talk about the potential roadblocks.
Setting up and using the API Connector is not for the faint of heart. You might need to put on your developer hat or bribe your tech team with donuts to get it up and running. Understanding API functionalities and potentially writing scripts for complex data extraction can be a hurdle.
If your team is more marketing-savvy than tech-savvy, make sure you’ve got resources lined up to help you navigate the API labyrinth.
While the API Connector is flexible, it’s not a magic wand. Some advanced data acrobatics might still require you to get your hands dirty with coding compared to directly accessing the UA API through coding.
If your team requires highly customized data extraction or complex data manipulation, explore the possibility of directly using the UA Reporting API with developer involvement.
Our verdict

Google Analytics Sheets Add-On for UA Data Backup: The Abandoned Ship
The Google Analytics Sheets Add-On seems like a convenient life raft for your UA data, but it’s got some leaks.
As of December 2023, the add-on is running on fumes with no support in sight. It’s like relying on a discontinued product – not exactly a confidence booster.
It’s important to note that for these reasons we do not recommend using this method.
Our verdict

Google Sheets might start sweating if you try to cram too much data into it. Backing up large historical datasets from UA might lead to performance issues, formatting inconsistencies, or even data loss.
The add-on retrieves data based on the chosen report configuration within UA. It might not capture the entire historical dataset, especially if you don’t pull every single report or use extensive filtering. Custom metrics or configurations not included in the chosen reports could be missing.
Another Word of Caution
While this process may seem straightforward, it’s crucial to reiterate that we do not recommend relying on the Google Analytics Sheets Add-On for backing up your UA data. As we discussed earlier, it has several limitations and may not provide a reliable, long-term solution for preserving your historical data. You may find the addon here. More about the alternative method here.
Google Analytics Reporting API and Looker Studio: The Developer’s Playground
While the Google Analytics Reporting API and Looker Studio offer a powerful combination for exporting UA data to Cloud storage and advanced analysis, there are challenges to consider.
You’ll need to speak fluent developer or have a tech wizard on speed dial to make this work. Prepare for some long nights and a few frustrated screams as you set up and configure the API. It’s not a quick and easy process, especially if you’re starting from scratch. Understanding API functionalities, writing scripts for data extraction, and managing authentication processes can be daunting for non-technical users.
Setting up and configuring the API for data extraction can be time-consuming, and this investment might not be feasible for all teams before the July 2024 deadline. One misplaced line of code and your data extraction and quality could go haywire. Not only that, but the Google Analytics Reporting API has a strict data request limit as well. Trying to export a massive dataset could have you bumping into walls left and right.
Challenges of Looker Studio Integration
Looker Studio is a powerful tool, but it’s got a learning curve steeper than a double black diamond ski slope. Get ready for some intense training sessions for your marketing team.
Transforming your historical data in Looker Studio could feel like trying to solve a Rubik’s cube blindfolded, but it’s doable.
To leverage the Google Analytics Reporting API, follow these high level steps to export data to Cloud storage and connect to Looker Studio for advanced analytics:
- Access Google Analytics Reporting API: Ensure you have access to the Google Analytics Reporting API within your Google Analytics account.
- Export Data to Cloud Storage: Use the Google Analytics Reporting API to export your desired data to Cloud storage for secure storage and easy access.
- Connect to Looker Studio: Establish a connection between the exported data in Cloud storage and Looker Studio for advanced analytics and visualization capabilities.
- Explore Advanced Analytics: Leverage Looker Studio’s features to delve into more detailed analytics, create custom reports, and gain deeper insights from your Google Analytics data.
Our verdict

Third-Party Connectors for UA Data Backup
Supermetrics BigQuery Connector Add-on
While the Supermetrics BigQuery Connector Add-on offers a streamlined approach to exporting Universal Analytics datasets to Google BigQuery, enhancing efficiency and simplifying the data transformation process, it’s important to weigh its benefits against potential limitations.
Supermetrics can be a real time-saver, automating the data extraction process, eliminating manual data extraction, providing a more accessible interface than the Google Analytics Reporting API and making your life a whole lot easier. But that convenience comes with a price tag that may not fit every budget, and you will need to roll up your sleeves and put in some initial setup time and a basic level of technical proficiency.
Analytics Canvas
Analytics Canvas provides a visual interface for crafting data pipelines, making the integration process potentially more approachable than direct coding against APIs. It can help merge UA data with insights from other marketing channels, delivering a snapshot of the customer journey. Additionally, the platform stands out for its customization capabilities, allowing for tailored data transformation and in-depth analysis.
However, embracing Analytics Canvas comes with its own set of considerations.
New users might find there’s a learning curve to navigate, as maximizing the platform’s potential requires familiarization with its tools and features. Pricing is another aspect to deliberate; the cost structure of Analytics Canvas can be intricate. The costs can fluctuate based on your data volume and how many bells and whistles you need. Moreover, the level of technical support available can vary significantly depending on the subscription plan you choose. If you’re hoping for white-glove support, you might need to upgrade to a premium plan, which could be a crucial factor for teams requiring ongoing assistance.
Our verdict

BigQuery Export with Google Analytics Reporting API: Powerful but Proceed with Caution
BigQuery, a powerful cloud data warehouse from Google, can store and crunch massive amounts of information. The Google Analytics Reporting API acts as a bridge, offering a programmable pathway for extracting Universal Analytics data, into BigQuery.
But before you start funneling, you’ll need to put on your coding hat and the Google Analytics Reporting API for BigQuery export involves scripting to automate the extraction and periodic transfer of UA data into BigQuery. This method ensures that valuable historical data is not just preserved but also made readily accessible for analysis. Once in BigQuery, the data resides in tables that support efficient management and analysis, allowing for the fusion of UA data with other sources, thereby painting a fuller picture of marketing endeavors.
Why BigQuery?
BigQuery stands out for its ability to house and analyze vast datasets, unlocking deeper insights that were previously inaccessible. One of the key advantages of BigQuery is its scalability. As your data grows, BigQuery seamlessly accommodates the increased volume, ensuring that your analytical capabilities keep pace with your expanding dataset. This means you can continue to extract valuable insights without worrying about hitting storage limits or performance bottlenecks.
Another significant benefit of BigQuery is its ability to integrate data from various sources. You can combine your UA data with information from other marketing channels, creating a holistic view of your marketing efforts. This integration enriches your analysis, allowing you to identify trends, patterns, and correlations that may have gone unnoticed when examining data in silos.
Yet, the Path Is Not Without Its Thorns
Harnessing the API for data exports requires some serious scripting skills. It’s not for the faint of heart or the code-phobic.
While BigQuery provides ample storage capacity, it’s not an unlimited resource. You’ll need to monitor your data volume and usage closely to avoid unexpected budget overruns. Implementing proper data governance practices and setting up alerts can help you stay on top of your BigQuery costs.
Once your data is successfully loaded into BigQuery, you may encounter a learning curve when it comes to querying and manipulating the data. SQL (although there are BI tools you can use for self-serve analytics) for data retrieval and analysis, can be a new skill for many marketing professionals. Investing time and providing your team with the necessary resources will be crucial to unlocking the full potential of your data in BigQuery.
The BigQuery Export feature
In a parallel exploration, the BigQuery Export feature offers a streamlined way for exporting data from Google Analytics directly into BigQuery. This process, while potentially daunting due to the technical expertise required, opens doors to data analysis.
However, similar challenges persist. Setting up and managing BigQuery Export requires a bit of technical finesse. It’s not a “set it and forget it” situation.
You’ll also want to keep a watchful eye on your data storage costs. BigQuery can hold a ton of data, but it’s not a bottomless pit. And let’s not forget about data governance. With great data comes great responsibility. You’ll need to be extra diligent to ensure your data stays squeaky clean and compliant.
Our verdict

Tackling the UA Sunset with Maya’s Free Google Analytics Integration
Extracting juicy insights from UA data can feel like trying to squeeze water from a rock. The setups are complex, the costs are high, and the data wrangling is enough to make your head spin.
But what if there was a way to skip the headaches and jump straight to the good stuff? Enter Maya, your new best friend in the world of UA data analysis.
Maya gives you the ability to backup Universal Analytics data — for FREE.

Why Maya Could Be Your Game-Changer
At Maya, we understand the challenges you face in harnessing the full potential of your UA data.
Connecting your GA account to Maya is as easy as pie. Just a few clicks and your data is ready. Maya will whisk your Universal Analytics data off to BigQuery, ensuring it is ready for analysis or archiving.
Do you recall when we discussed above in this article about data models, connecting the dots and channel data? Unlike raw data, Maya provides a pre-built, marketing-centric data model tailored for UA analysis – no transformation required!
With Maya’s pre-built data model, your UA data arrives analysis-ready with key marketing measures and dimensions structured for you.
And do you recall about the need for SQL or self-serve analytics platforms? Just connect to BI tools like Data Studio or Power BI. That way you get ready made dashboards that can give you cross-channel information and attribution and visualize your critical UA metrics.
You may even slice data across business-friendly attributes like product categories, brands and more that you set up in the UI.
Moreover, Maya’s flexible integration allows you to easily expand your data sources beyond UA. You can effortlessly incorporate data from various marketing automation platforms, CRM systems, ERP solutions, and more. Maya supports a wide range of data sources, including SaaS applications, databases, and files, giving you the freedom to mix and match your data inputs as needed.
Leverage Maya’s Scalable BigQuery Infrastructure
For companies seeking a seamless and efficient way to manage their data, Maya’s shared BigQuery infrastructure offers a compelling solution. By leveraging Maya’s BigQuery, you can say goodbye to the worries of storage costs and maintenance, as Maya takes care of these aspects for you.
Whether you’re dealing with a few gigabytes or petabytes of data, Maya’s infrastructure can handle it all. As your data volume grows, Maya’s BigQuery seamlessly scales to accommodate your needs, ensuring that you can continue to analyze and derive value from your data without any performance bottlenecks.
Additionally, Maya’s team of expert engineers provides 24/7 monitoring and management of the BigQuery infrastructure, ensuring optimal performance and reliability. Simply connect your preferred BI tools, such as Data Studio or Power BI, and begin visualizing your insights immediately.
It’s the perfect hassle-free solution for companies wanting enterprise-grade data warehousing without the operational burden.
Plug Maya into Your Existing BigQuery Setup
For larger enterprises that already have established data warehousing and ETL processes, Maya offers a flexible and seamless way to integrate your UA data into your existing BigQuery environment. Already rocking a BigQuery data warehouse? No problemo! Connect Maya to Your Google BigQuery Cloud Data Warehouse.
Connecting Maya to your BigQuery is a simple process. Maya deploys secure and managed data pipelines that efficiently transfer your UA data into a new or existing BigQuery dataset. This ensures that your UA data is archived into your data warehouse.
One of the key advantages of integrating Maya with your BigQuery is the automatic provisioning of Maya’s semantic data model. This means that you can start analyzing your UA data alongside your existing data sources without the need for extensive data modeling or transformation. Maya’s semantic data model is designed to work seamlessly with your BigQuery setup, saving you time and effort in the integration process.
FAQs
What is Google Analytics backup data?
Google Analytics backup data involves saving copies of your analytics data to prevent loss and ensure access to historical information for analysis and decision-making.
How can I back up my Google Analytics data?
You can back up your Google Analytics data by manually exporting reports, using the Google Analytics API, employing third-party backup tools, or integrating with Google BigQuery for automatic backups (for Google Analytics 360 users).
Why is it important to back up Google Analytics data?
Backing up Google Analytics data is crucial for maintaining data integrity, enabling long-term analysis and comparison, and complying with data retention policies or regulations. And don't forget that you will lose all your data forever if you don't backup it up before the 1st of July, 2024.
Can I restore my Google Analytics data from a backup?
While you can't upload backup data directly back into Google Analytics, you can use the backed-up data for external analysis and reporting, helping to reconstruct historical insights and reports.